
Introduction to Tableau
1. What is Tableau?
Tableau is an analytics solution that allows users to connect, analyze, and share data, rapidly growing and making a significant impact in the field of Business Intelligence (BI). Initially developed as a data visualization tool, it has evolved into an enterprise platform with various deployment options. By 2019, Tableau was acquired by Salesforce, and today, its products have been integrated into the broader Salesforce ecosystem, competing with alternatives like Looker, Sisense, or Qlik.

With Tableau, users can connect all their data sources and use visual charts combined with some capabilities of Salesforce Einstein to identify relevant trends in their data and make predictions about business operations. For a long time, Tableau has been the preferred choice for users who enjoy a drag-and-drop interface for creating charts and visualizations. Today, with its superior data management capabilities, Tableau has become the top BI tool for businesses.
1. The Role of Tableau
As the demand for data analysis continues to grow, especially for large enterprises, Tableau has established its critical role as an indispensable tool. Tableau is renowned for its diverse data visualization capabilities and is often used as a replacement for traditional BI tools. Since its introduction, Tableau has significantly changed how companies perceive data.
Instead of spending significant time and effort on traditional BI reports/tools, Tableau enables businesses to quickly generate interactive reports, allowing users to easily identify trends and make accurate decisions based on real data. By transforming dry numbers into visual charts, Tableau has helped business leaders grasp the bigger picture, allowing them to strategically guide and optimize business operations more effectively.
2. How Tableau Works
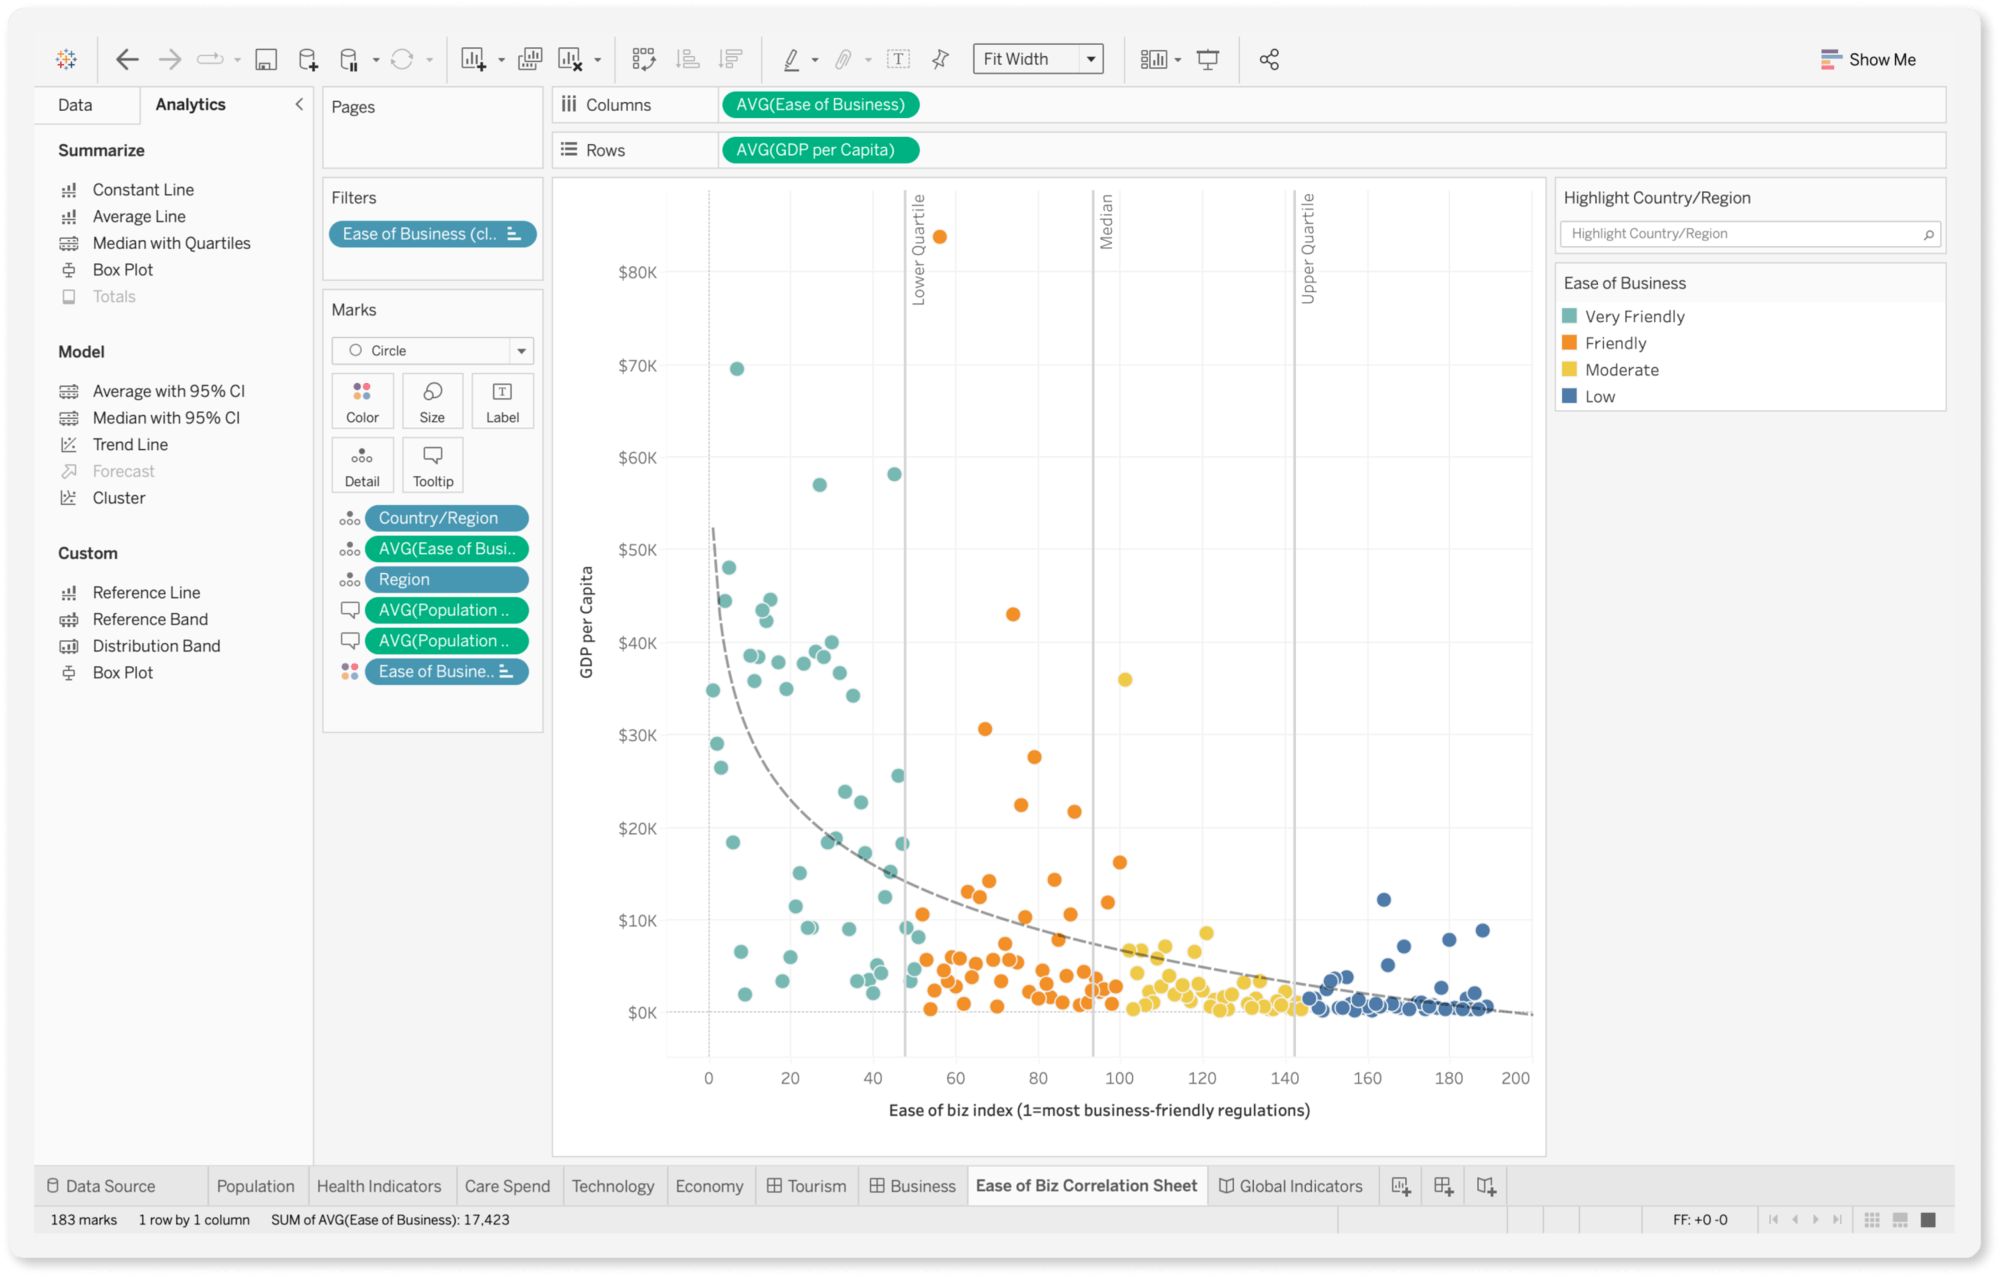
Tableau operates by efficiently connecting, processing, and visualizing data. First, Tableau allows users to easily connect to various data sources such as databases, Excel files, or cloud data. Users can then clean and prepare the data before creating visual charts through a user-friendly drag-and-drop interface. Tableau supports many types of charts and allows users to interact with the data by filtering, drilling down, and highlighting key parts.
Finally, analysis results can be shared through Tableau Server or Tableau Online or embedded into other applications. Additionally, with the integration of AI analytics capabilities from Salesforce, such as Einstein Analytics, Tableau enhances predictive analytics and data-driven decision-making.
3. What Products and Features Does Tableau Offer?
Tableau provides a range of products and services to support data analysis and visualization. The products and features include:
- Tableau Cloud: The new version of Tableau Online offers a fully cloud-based analytics solution. Customers can use it to prepare, create, analyze, publish, and share data in one place. Tableau Cloud is part of the Tableau Creator package, which includes Tableau Desktop and Tableau Prep Builder.
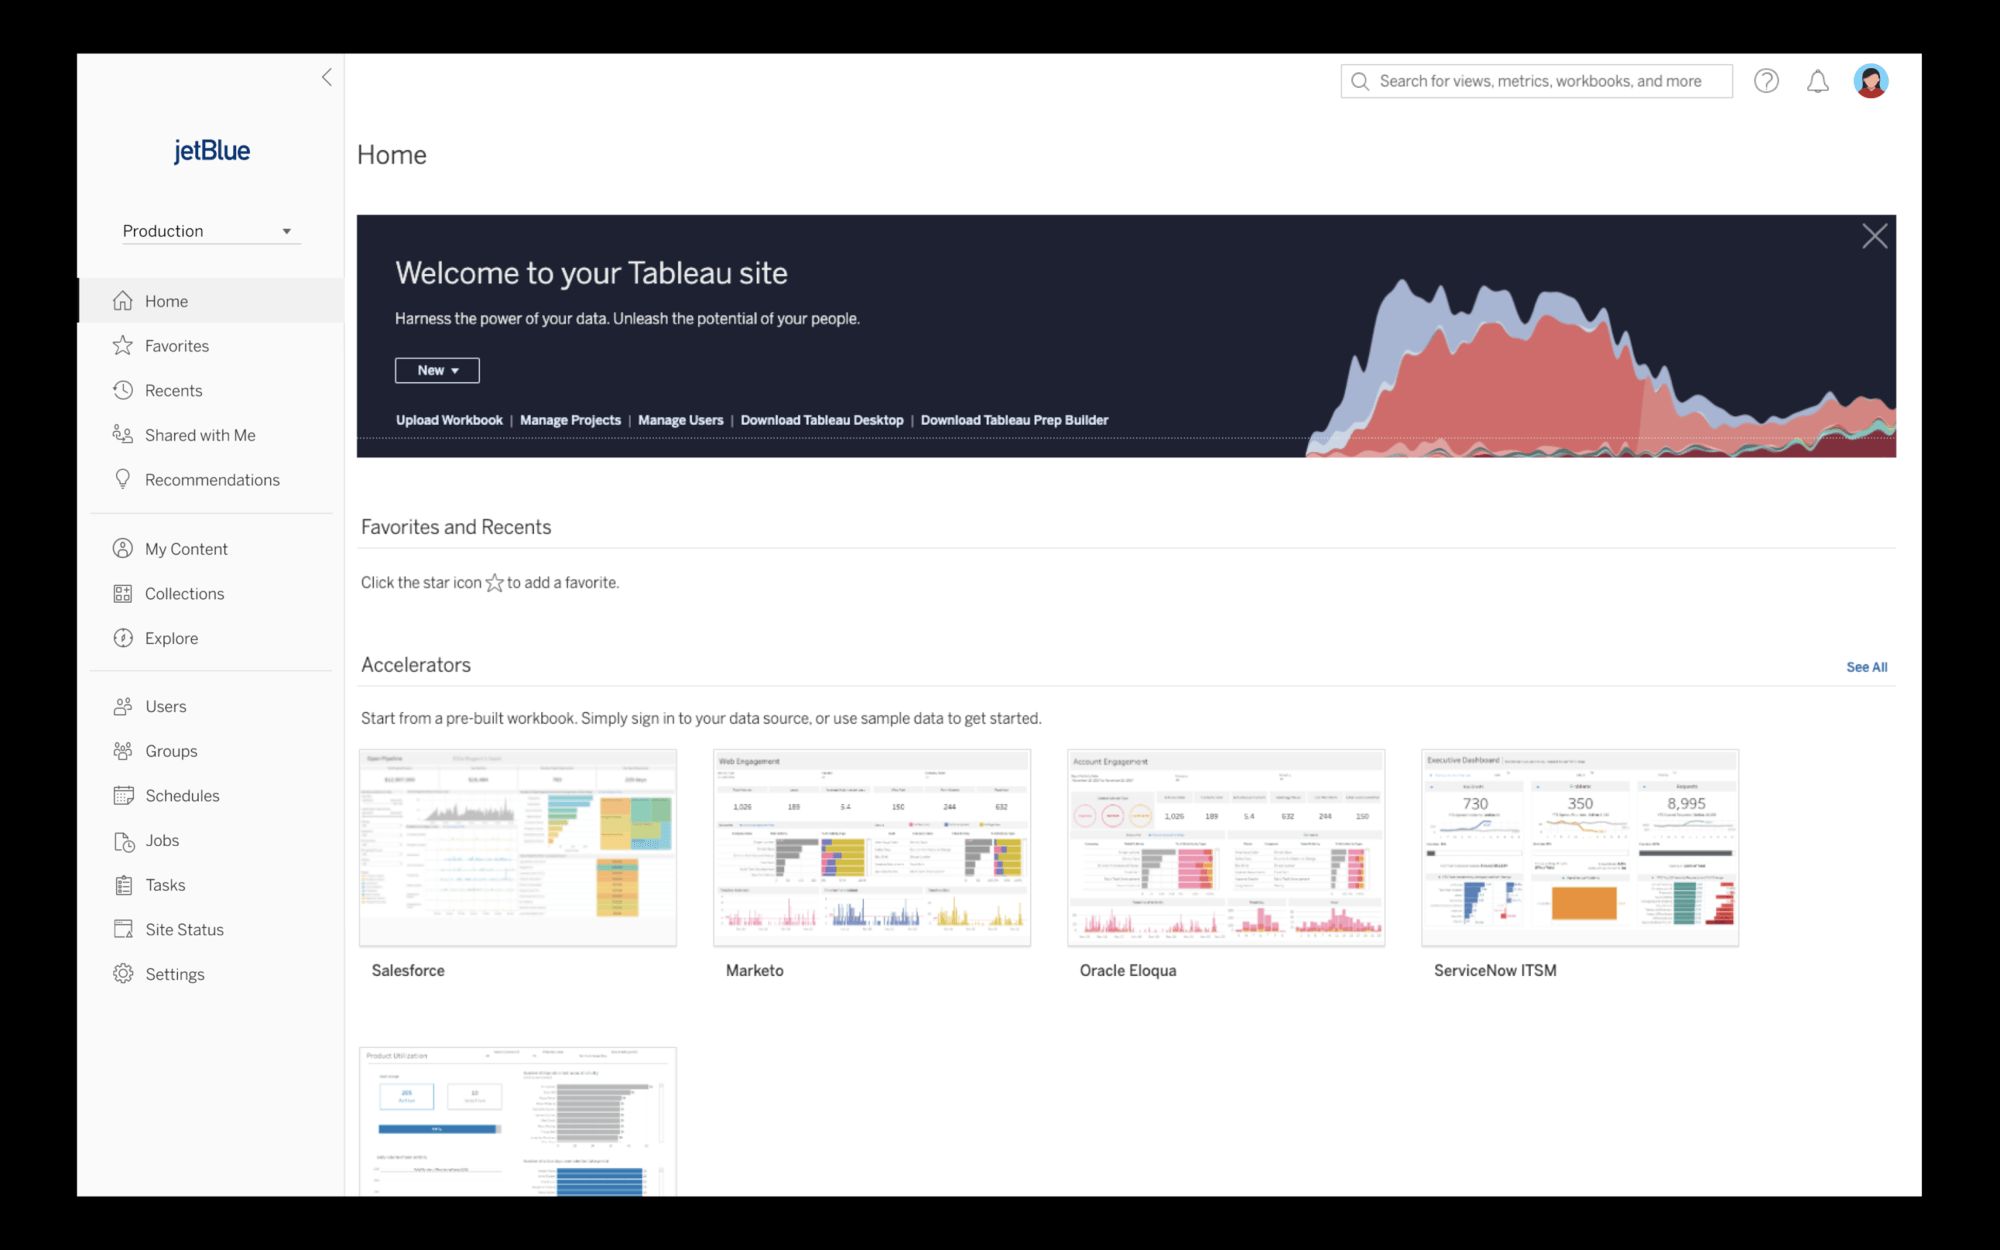
- Tableau Desktop: Provides data visualization and analysis tools in a more controlled environment, suitable for companies with strict management and security policies that do not want to operate entirely on the cloud.
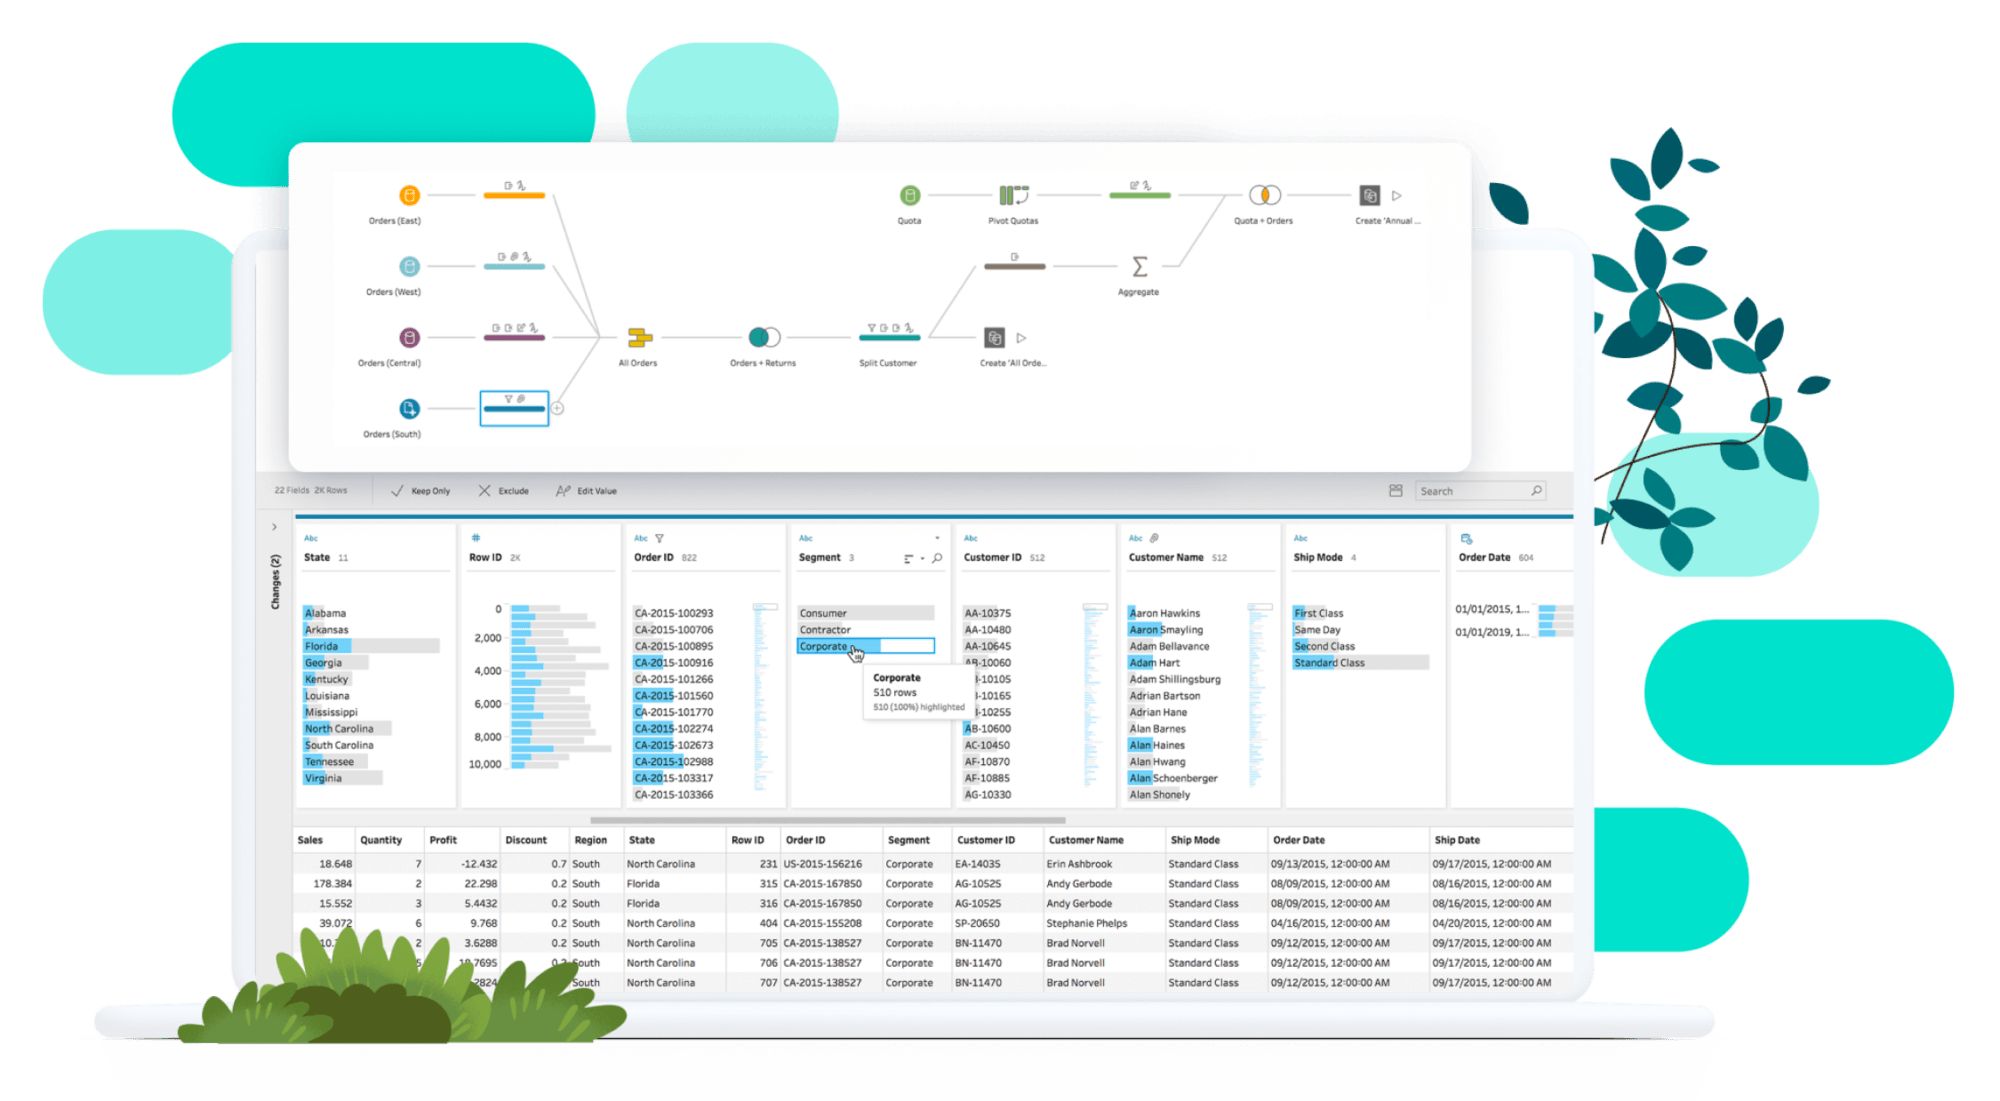
- Tableau Prep Builder: A tool that helps prepare data for analysis by combining, shaping, and cleaning data. It is included in the Tableau Creator license.
- Tableau Server: This is a self-hosted solution, ideal for organizations with IT resources that want to host Tableau within their own IT infrastructure.
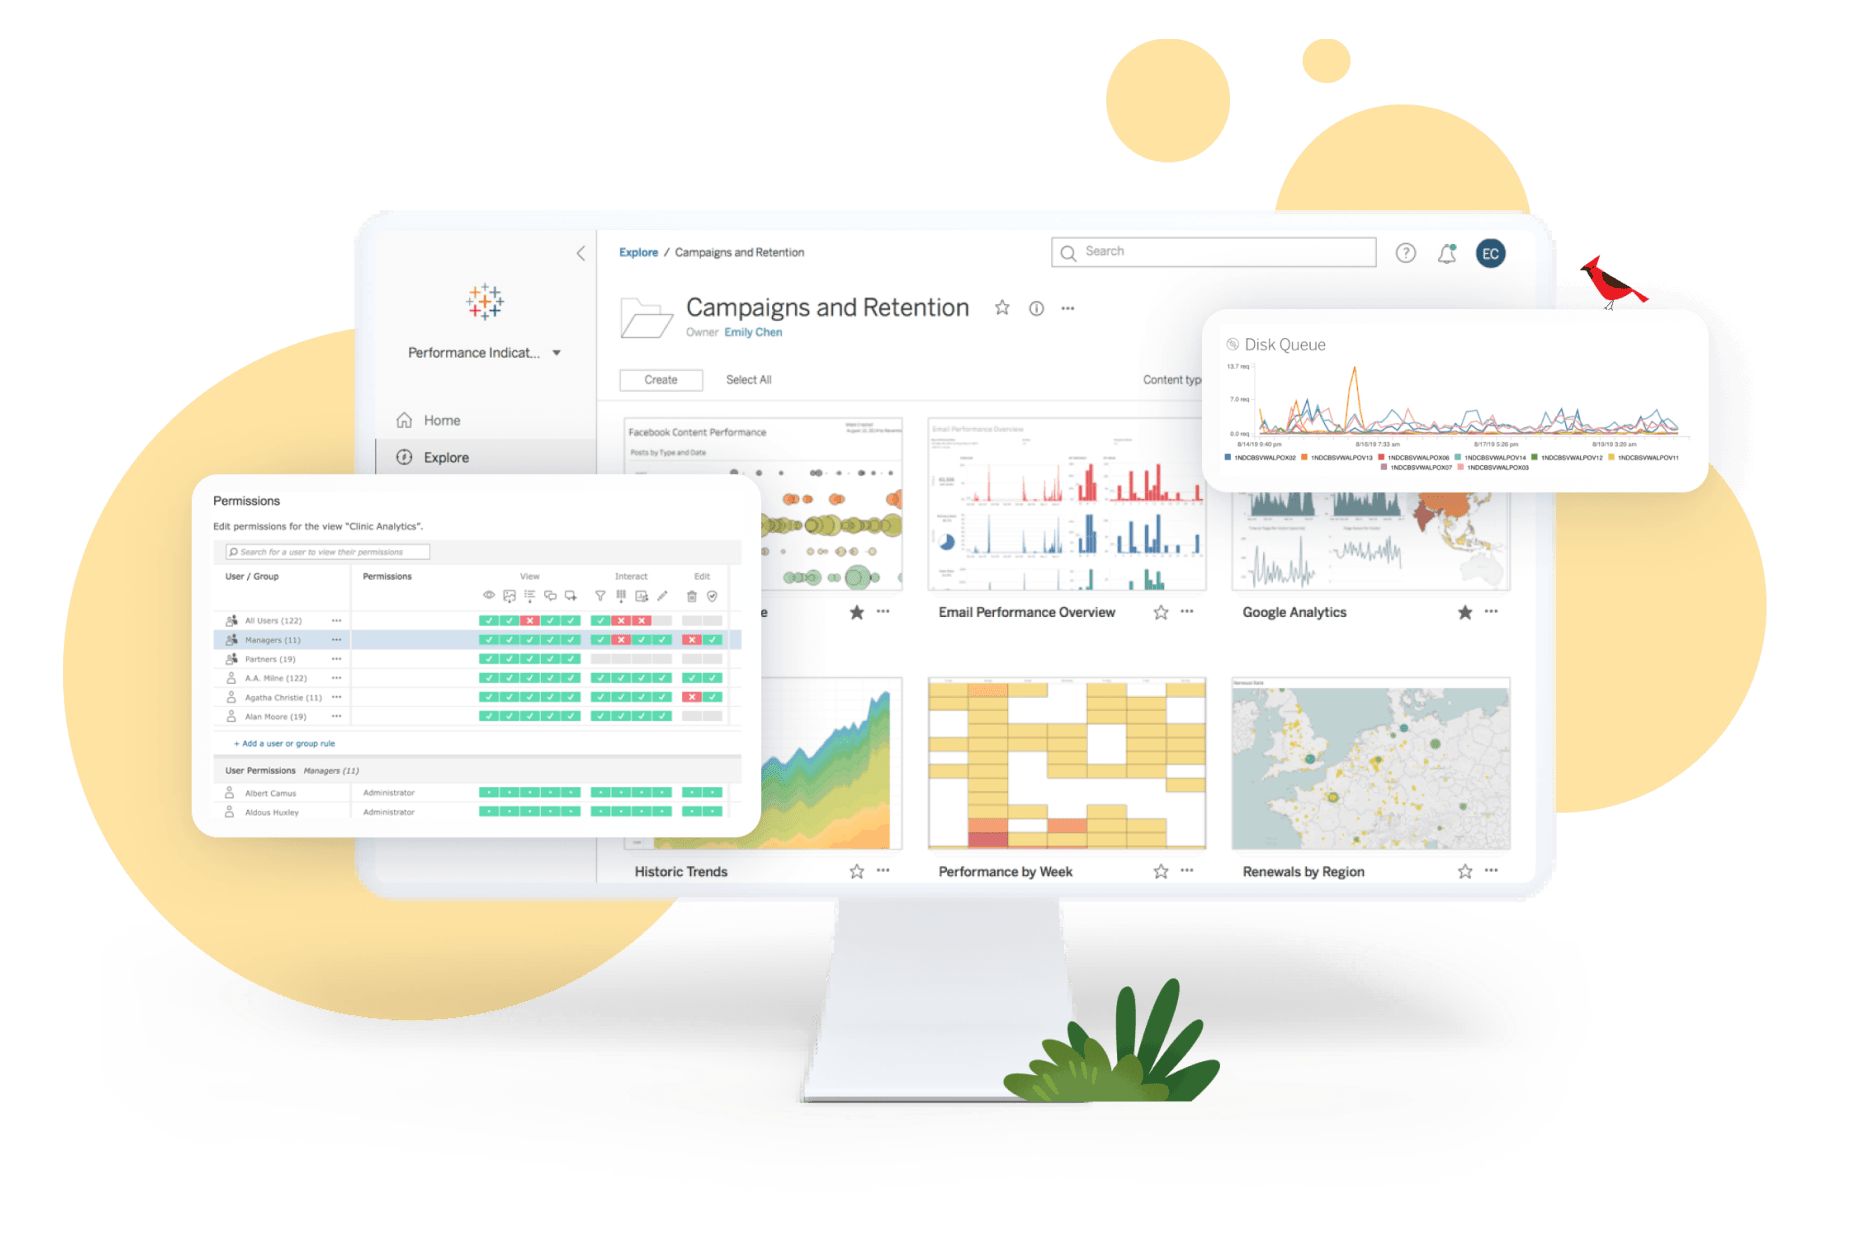
- Data Management and Integration: Tableau offers several built-in features that support centralized management, visibility, and control, including automatic authentication and permission management. Users can also leverage integrations with tools like Slack, bringing data into everyday conversations and workflows. Tableau/Salesforce also provides training videos, a community platform, and cloud support for customers, including the "Exchange," where users can access resources built by both Tableau and third-party partners.
Common Use Cases for Tableau
Business stakeholders often use Tableau to view standard KPI reports for marketing, sales, and customer success management. Especially since Salesforce Data Cloud integrated Tableau’s visual charts into the Customer 360 platform, Tableau has become an essential tool for teams needing quick access to departmental metrics. With Tableau, business users can build various types of charts to observe trends or filter and deep dive into data.
Tableau is primarily used for the following purposes:
- Data Visualization: Transforming raw data into easy-to-understand and visually engaging charts, graphs, and maps.
- Business Intelligence (BI): Providing decision-makers with insights from data analysis to make informed decisions.
- Data Analysis: Exploring and analyzing large datasets to discover trends, patterns, and anomalies (without the need for SQL).
- Dashboard Creation: Designing interactive, real-time dashboards that provide an overview of key performance indicators (KPIs).
- Operational Reporting: Producing visually appealing reports that effectively convey data-driven insights.
Differences between Tableau and Microsoft Power BI
Tableau remains highly favored due to the increasing importance of visualization and analysis in Business Intelligence (BI). With its ease of use, powerful analytical capabilities, and integration with multiple data sources, Tableau is a popular choice for organizations across various sectors. As the demand for actionable insights continues to grow, the demand for Tableau skills is expected to remain strong.
Although both Tableau and Microsoft Power BI are popular data visualization and BI tools, there are some key differences:
1. Interface Design
Tableau's interface focuses on visual elements and helps users achieve clear analytical insights, while Power BI emphasizes the data model that leads to visualizations. The process of creating visualizations differs slightly (e.g., drag-and-drop versus using menus), but both can achieve similar results.
2. Data Processing Capabilities
Tableau typically performs better with pre-structured datasets (which can be created in Tableau Prep), while Power BI has built-in tools like Power Query and Power Pivot within the Power BI application. Both tools can handle large datasets when properly structured.
3. Pricing
Power BI is often considered more affordable than Tableau, especially since Microsoft licenses include basic access to Power BI. When considering total cost of ownership, both tools have different pricing models that scale according to the number of users, and this needs to be considered for a fair comparison based on the specific needs of each organization. Evaluating software pricing is especially important for both large and small businesses.
4. Machine Learning
Tableau tends to offer more flexibility in customizing visualizations and is often regarded as having a more refined, intuitive interface compared to Power BI. As with any analytics tool, the skill and experience of the developer play a critical role in the final result.
Why is Tableau popular among data analysts?
Tableau's strength lies in its versatility across industries to view and understand data effectively:
- Sales & Marketing: Analyze customer behavior, track sales performance, and update market trends.
- Finance: Monitor financial performance, analyze budgets, and forecast revenue.
- Operations: Track internal KPIs, optimize supply chain processes, and manage human resource workflows.
- Human Resources: Identify trends in employee demographics, turnover, retention, recruitment, and management performance.
One of Tableau’s standout features is that it doesn't require users to have deep technical expertise. Users don’t need a programming or technical background to start using the tool immediately. Additionally, Tableau supports working with unstructured data, offering flexibility in data visualization.
Conclusion
Tableau is an ideal tool for data visualization, with an easy-to-use interface, strong integration capabilities, and flexible connections to various data sources. Even without programming skills, users can create compelling visualizations and efficiently analyze data. For a seamless and insightful experience, Tableau is a tool worth considering.
Salesforce
Salesforce CRM is one of the world’s leading customer relationship management (CRM) platforms, widely used by both large and small organizations globally. With its flexible features and applications, Salesforce helps businesses strengthen customer relationships, optimize the sales process, and drive revenue growth by providing powerful management tools and insights.
Some of Salesforce’s standout features that support effective business management include: marketing management, customer relationship management, sales management, and integration with other applications and systems.