Learn how data reporting, business management reports, and business data analytics help organizations make better decisions. Discover data visualization techniques and Salesforce CRM reporting solutions with OMN1 Solution.
What Is Data Reporting and Why Does It Matter?
Data reporting is the process of collecting, organizing, analyzing, and presenting information from various sources to evaluate business performance, identify trends, and support decision-making. Instead of relying on assumptions or fragmented reports, businesses can use reliable data to identify issues and determine appropriate actions.
In practice, many organizations still consolidate reports manually in Excel using data from multiple departments. When information is inconsistent or updated slowly, managers may struggle to understand business performance and identify the reasons behind changes in results.
An effective data reporting system requires three essential elements: reliable data, consistently defined metrics, and information presented in a format that meets users' needs.
What Should Business Management Reports Include?
Business management reports help leaders monitor operations and evaluate progress toward business objectives. The metrics included should reflect the business model and management priorities rather than applying the same KPIs to every department.
Common reporting categories include:
- Sales reports: Revenue, conversion rates, opportunity values, and progress toward sales targets.
- Marketing reports: Lead volume, customer acquisition costs, and campaign conversion performance.
- Customer service reports: Response times, resolution times, and customer satisfaction.
- Operational reports: Workload, processing time, and workflow completion rates.
For example, if revenue declines while lead volume remains stable, managers should examine conversion rates, opportunity quality, and sales performance to identify potential causes. Effective reporting helps managers determine what action to take rather than simply displaying numbers.
How Does Statistical Reporting Software Improve Business Operations?
Statistical reporting software helps businesses automate data aggregation, filtering, classification, and presentation from connected data sources. Compared with manual reporting, a suitable system can reduce repetitive work and provide teams with more consistent information.
When selecting reporting software, businesses should evaluate its integration capabilities, data refresh frequency, access controls, and flexibility to support different reporting requirements.
For organizations already using CRM, generating reports from customer and sales data can reduce the need to consolidate information manually from separate spreadsheets.
Salesforce provides Reports and Dashboards that allow users to analyze CRM data, monitor performance indicators, and present information visually. For organizations requiring more advanced analysis or insights across multiple data sources, additional analytics solutions within the Salesforce ecosystem may also be appropriate.
How Does Business Data Analytics Improve Decision-Making?
Business data analytics is the process of examining data to identify trends, relationships, and factors that influence business outcomes. Its purpose goes beyond reviewing figures; it helps organizations understand problems and develop evidence-based actions.
Businesses can approach analytics through four steps:
Step 1 – Define the business question: For example, why are deal conversion rates declining, or why is customer processing time increasing?
Step 2 – Collect and validate data: Check data sources, remove duplicate records, and standardize metric definitions.
Step 3 – Analyze trends: Compare performance over time, across regions, customer segments, or sales representatives.
Step 4 – Turn insights into action: Identify potential causes, adjust processes, and monitor the results of those changes.
When business data is connected to CRM, organizations can analyze the customer journey from marketing engagement and sales opportunities to customer service instead of evaluating each department in isolation.
What Is Data Visualization and Why Is It Important?
Data visualization is the process of presenting information through charts, graphs, maps, and dashboards to help users identify important insights more quickly.
Effective data visualization requires choosing the right format for the analytical objective. Line charts are useful for tracking trends over time, bar charts help compare categories, and dashboards consolidate multiple KPIs for management review.
However, visualization cannot compensate for inaccurate data or incorrect interpretation. Reports should clearly define reporting periods, measurement units, metric definitions, and comparison criteria to prevent misleading conclusions.
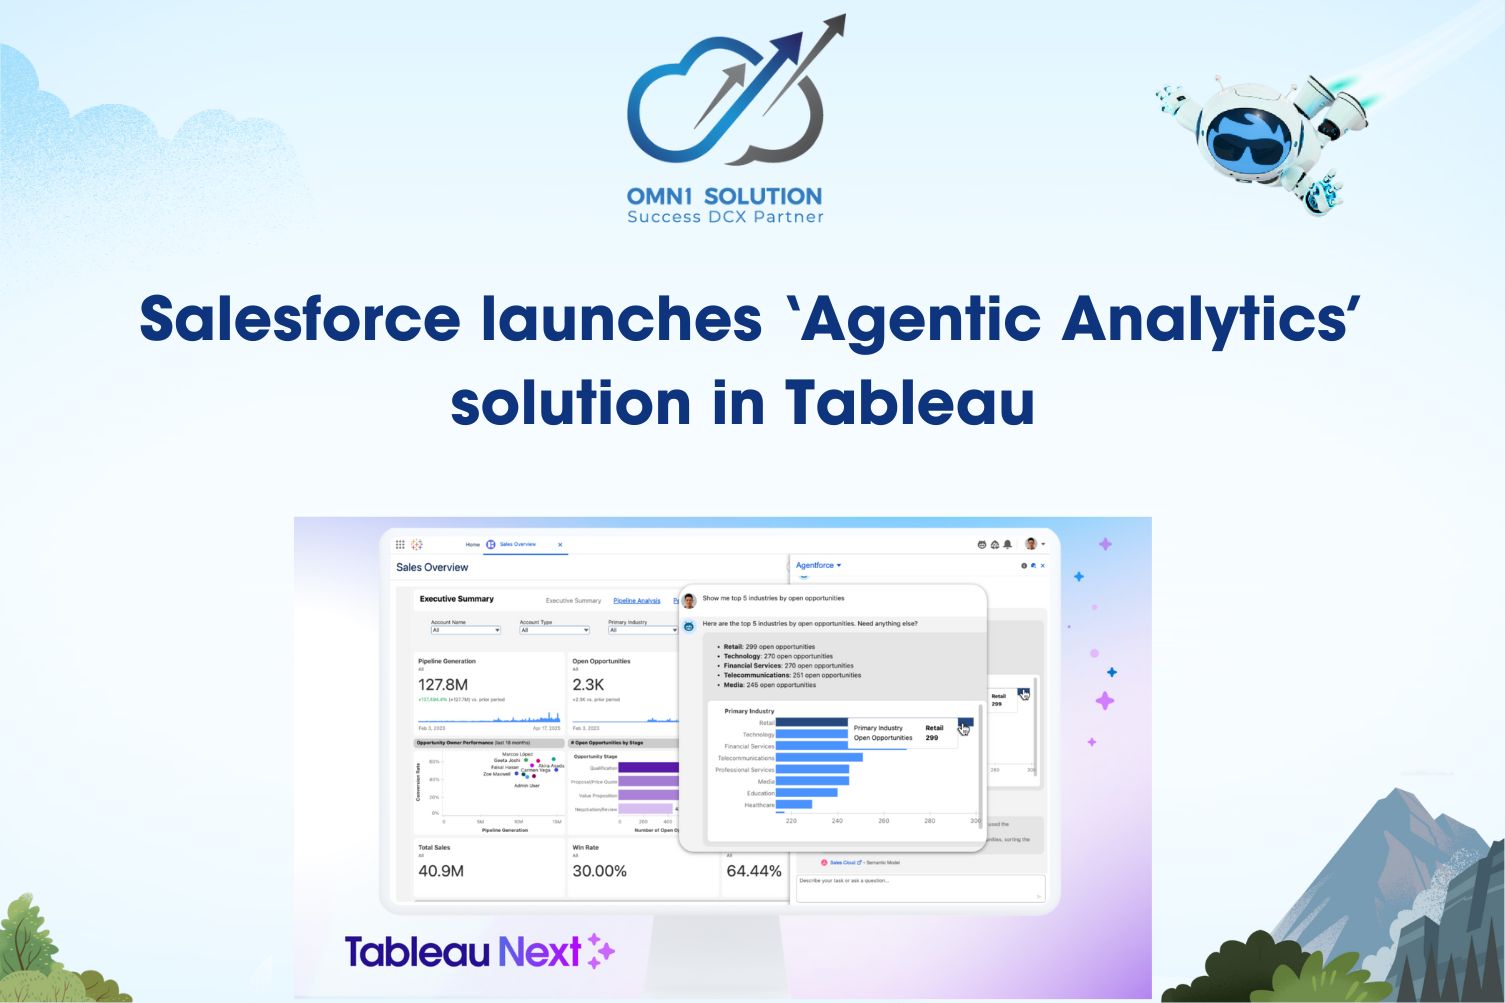
Using Salesforce and Tableau, businesses can build visual reports and dashboards to monitor performance, analyze trends, and support more informed decisions.
OMN1 Solution: Optimize Data Reporting with Salesforce CRM
Building a valuable reporting system requires connected data, standardized KPI definitions, and dashboards designed around real management needs.
OMN1 Solution provides Salesforce CRM consulting, implementation, and integration services to help businesses standardize customer data, optimize business processes, and improve performance visibility. Depending on business requirements, organizations can develop customized reports, connect relevant data sources, and design dashboards for different management roles.
A successful implementation should begin by identifying key business questions, assessing data quality, and agreeing on the metrics to monitor. Businesses can then determine the appropriate report structure, integration approach, and visualization tools.
This approach ensures that reporting capabilities are aligned with operational requirements and business objectives.
Conclusion
Data reporting is more than compiling figures. It provides a foundation for evaluating performance, analyzing business challenges, and making evidence-based decisions. By combining business management reporting, business data analytics, and data visualization with an appropriate CRM platform, organizations can strengthen operational visibility and identify opportunities for improvement.
OMN1 Solution supports businesses in consulting on and implementing Salesforce CRM to connect data, develop suitable reporting systems, and improve business management effectiveness.
👉 Contact OMN1 Solution to discuss a Salesforce CRM and data reporting roadmap tailored to your business objectives.