1. What is Tableau?
Tableau is a powerful software specialized in data visualization and data analytics, designed to help users understand and work with data easily and effectively. Tableau software is currently owned by Salesforce and continues to maintain its core value by offering a user-friendly interface, the ability to create visual charts and reports, and connectivity to many different data sources.
2. What features does Tableau offer?
Catalog
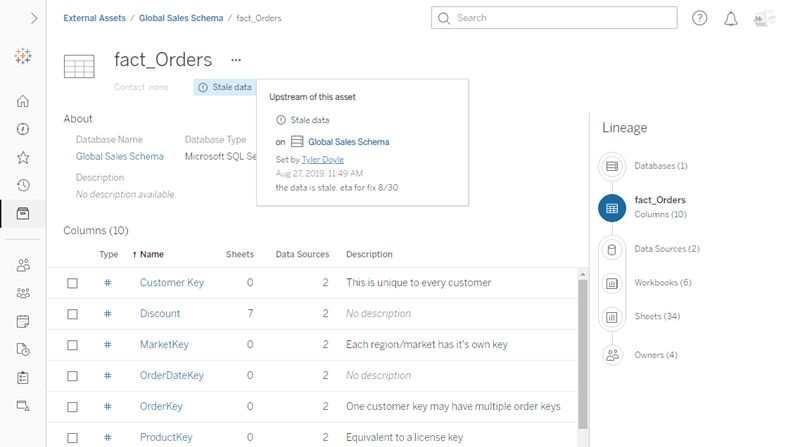
Enhanced data trust, visibility, and discoverability
Catalog automatically lists all your assets and data sources into a central inventory and provides contextual metadata for fast data discovery. It also helps you understand data lineage and integrates features such as lineage, impact analysis, data dictionary, data quality warnings, and in-app search across your Tableau environment, addressing these challenges differently from a standalone catalog.
Resource Monitoring Tool
Monitor Tableau environments at scale
The Resource Monitoring Tool, commonly referred to as RMT, is a powerful tool that helps you track the health and performance of your Tableau environment. It collects data from your servers and monitors the health and performance of your Tableau Server installation. By gathering server data and providing detailed insights into the current state of the system, RMT allows you to quickly diagnose the root causes of slow load times, extract failures, and other critical issues that may impact server performance. With this tool, you can closely monitor server performance and ensure it runs smoothly at all times.
Slack Integration
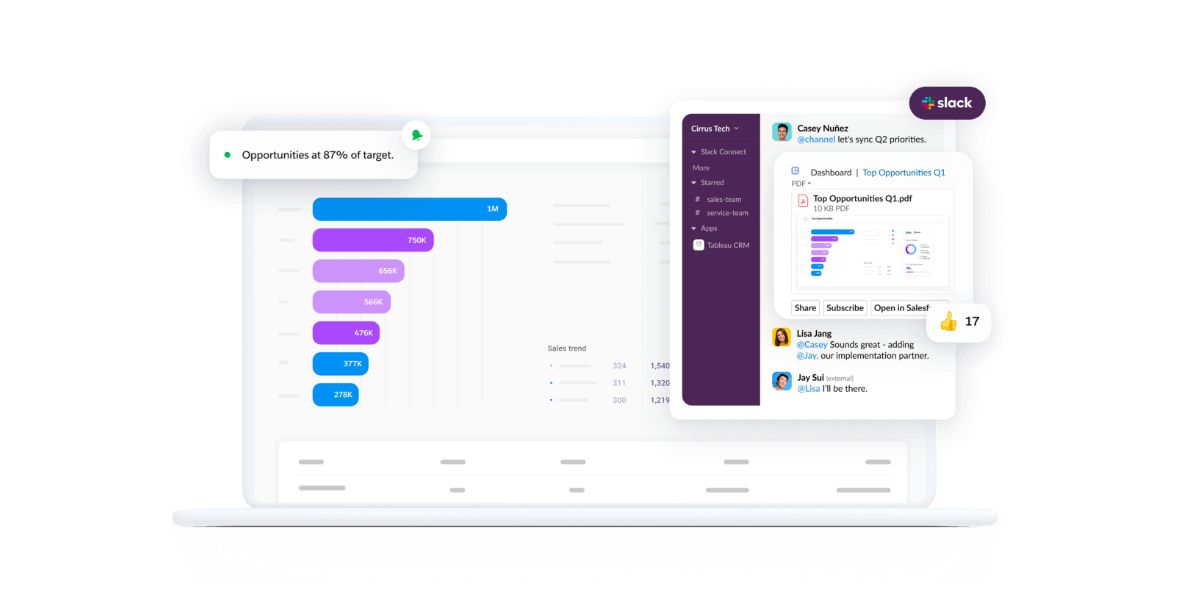
Unlock productivity with analytics
With the integration between the #1 analytics platform and the #1 communication platform, you no longer need to wait for reports or dashboards. Through this integration, notifications and alerts from Tableau can be delivered directly to Slack channels, enabling real-time updates on data changes and insights. Team members can easily share dashboards, visualizations, and Tableau insights within Slack, fostering immediate discussions and informed decision-making. You can truly deliver relevant, intelligent, and actionable insights directly into the workflow, accelerating time to insight across your organization.
Accelerator
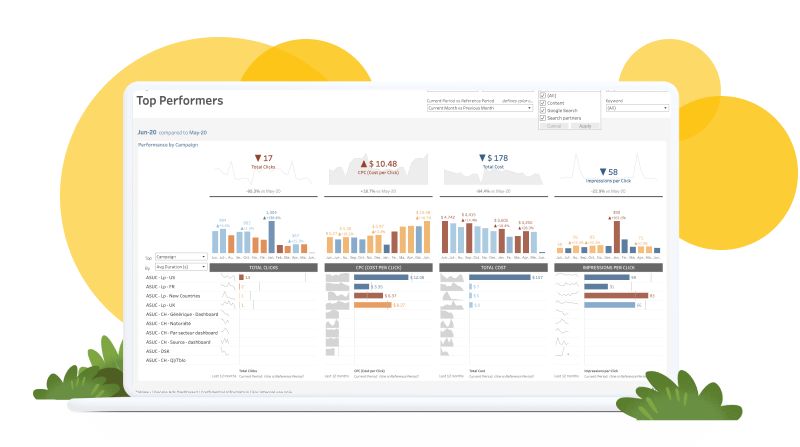
Instant access to best-practice analytics solutions
Accelerators are ready-to-use dashboards that you can connect to your data and customize to fit your needs, helping you gain data-driven insights faster. They allow you to speed up time to value with out-of-the-box dashboards that are fully customizable for your specific use case, regardless of industry, department, or function. You can leverage best practices to address more than 100 use cases today. And that’s not all; you can also extend and scale accelerators using your own datasets and partner solutions.
Bins
Easily group data points to simplify analysis
Bins in Tableau group continuous data into discrete intervals, making it easier to visualize and analyze data through histograms and other distribution views. They help transform complex datasets into understandable patterns so you can create groups of continuous measures visually without writing long IF statements. You can build charts from binned dimensions to quickly see data distribution.
Data Stories
Natural language insights from your data
Data Stories is a powerful tool that helps you save valuable time and resources by summarizing key insights clearly and concisely. With advanced capabilities, you can easily add automatically generated plain-language explanations to your dashboards in just seconds. Designed specifically for business users, Data Stories delivers an intuitive experience tailored to your needs. It also proactively surfaces relevant insights that might otherwise be overlooked, ensuring you stay ahead. Whether you are an analyst or a business leader, Data Stories is the perfect solution for streamlining workflows and extracting meaningful insights from your data.
Explain Data
Discover the “why” behind your data
Data exploration can be complex and time-consuming, but Explain Data makes it easy to uncover and describe relationships within your data. By allowing you to examine and pinpoint key data points, you can quickly and seamlessly dive deeper into marks within your visualizations. With just one click, Explain Data delivers AI-driven answers and easy-to-understand explanations for the value of any data point. In addition, the tool provides interactive visualizations, enabling you to explore your data in a more intuitive and engaging way.
Forecasting
Improve decisions with predicted future trends
Tableau enables analysts to build forecasting models directly within the platform. With native forecasting, you can create models that understand how your data is distributed around trend lines in your visualizations. Analysts can also leverage these capabilities within table calculations to gain deeper insights into their data. By using exponential smoothing, you can generate forecasts for any dataset with a date dimension. You can also use the automatic model, specify additive or multiplicative models, and apply forecasting models within table calculations.
Geospatial Analytics
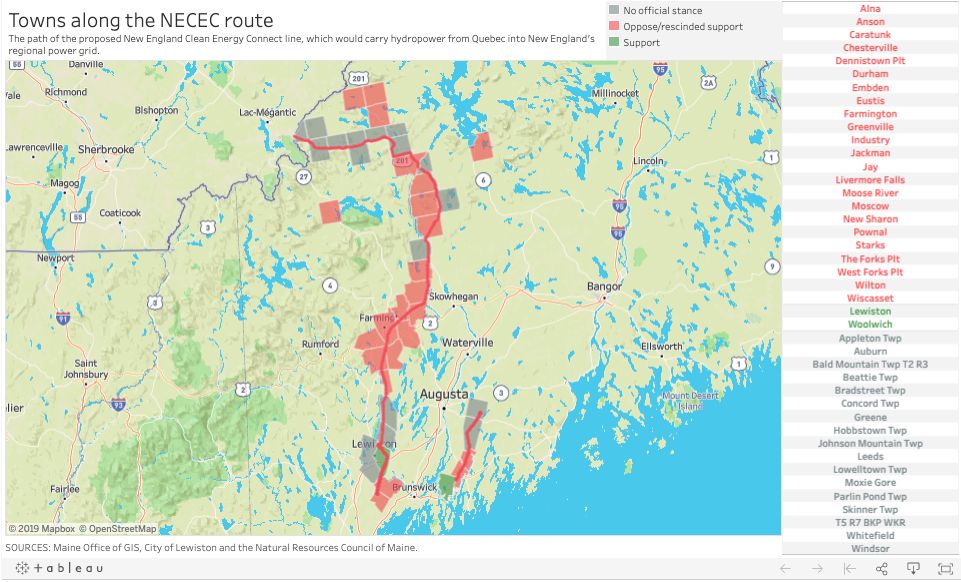
Location-based insights and ready-to-use custom geocoding
Geospatial analytics displays data in relation to its physical location. If you want to view your data geographically, you can map it directly in Tableau. You can easily gain spatial insights from all your enterprise data. By using geographic hierarchies, you can drill down into your data and uncover new insights. In addition, spatial joins allow you to visualize relationships between data and different spatial definitions. Finally, Tableau enables you to create custom territories using Tableau groups and overlay data with demographic information, providing a comprehensive view of your data.
Hyper
Enhance your analytics with an in-memory data engine
Hyper is Tableau’s extremely fast SQL engine that enables rapid real-time analytics, interactive exploration, and ETL transformations through Tableau Prep. This powerful in-memory data engine allows users to analyze large or complex datasets faster by efficiently executing analytical queries directly on transactional databases. Hyper significantly improves data processing speed, reduces load times, and enhances dashboard performance for all users. In addition, it enables faster data refreshes and extracts, delivering near real-time insights while minimizing storage requirements and memory footprint.
Image Role

Empower your analytics with embedded images
Incorporating visual content into Tableau is much easier with the help of Image Role. This powerful semantic field provides an automated and highly scalable solution for importing, aligning, reusing, and updating graphics. With Image Role, you can easily map images to links within your data and encode them into exportable rows and columns. By using images instead of hard-to-understand product names or item codes, you can significantly improve the user experience. In addition, these images are managed externally, keeping storage costs minimal and workbook size manageable. With Image Role, you can streamline your image content management workflow more than ever before.
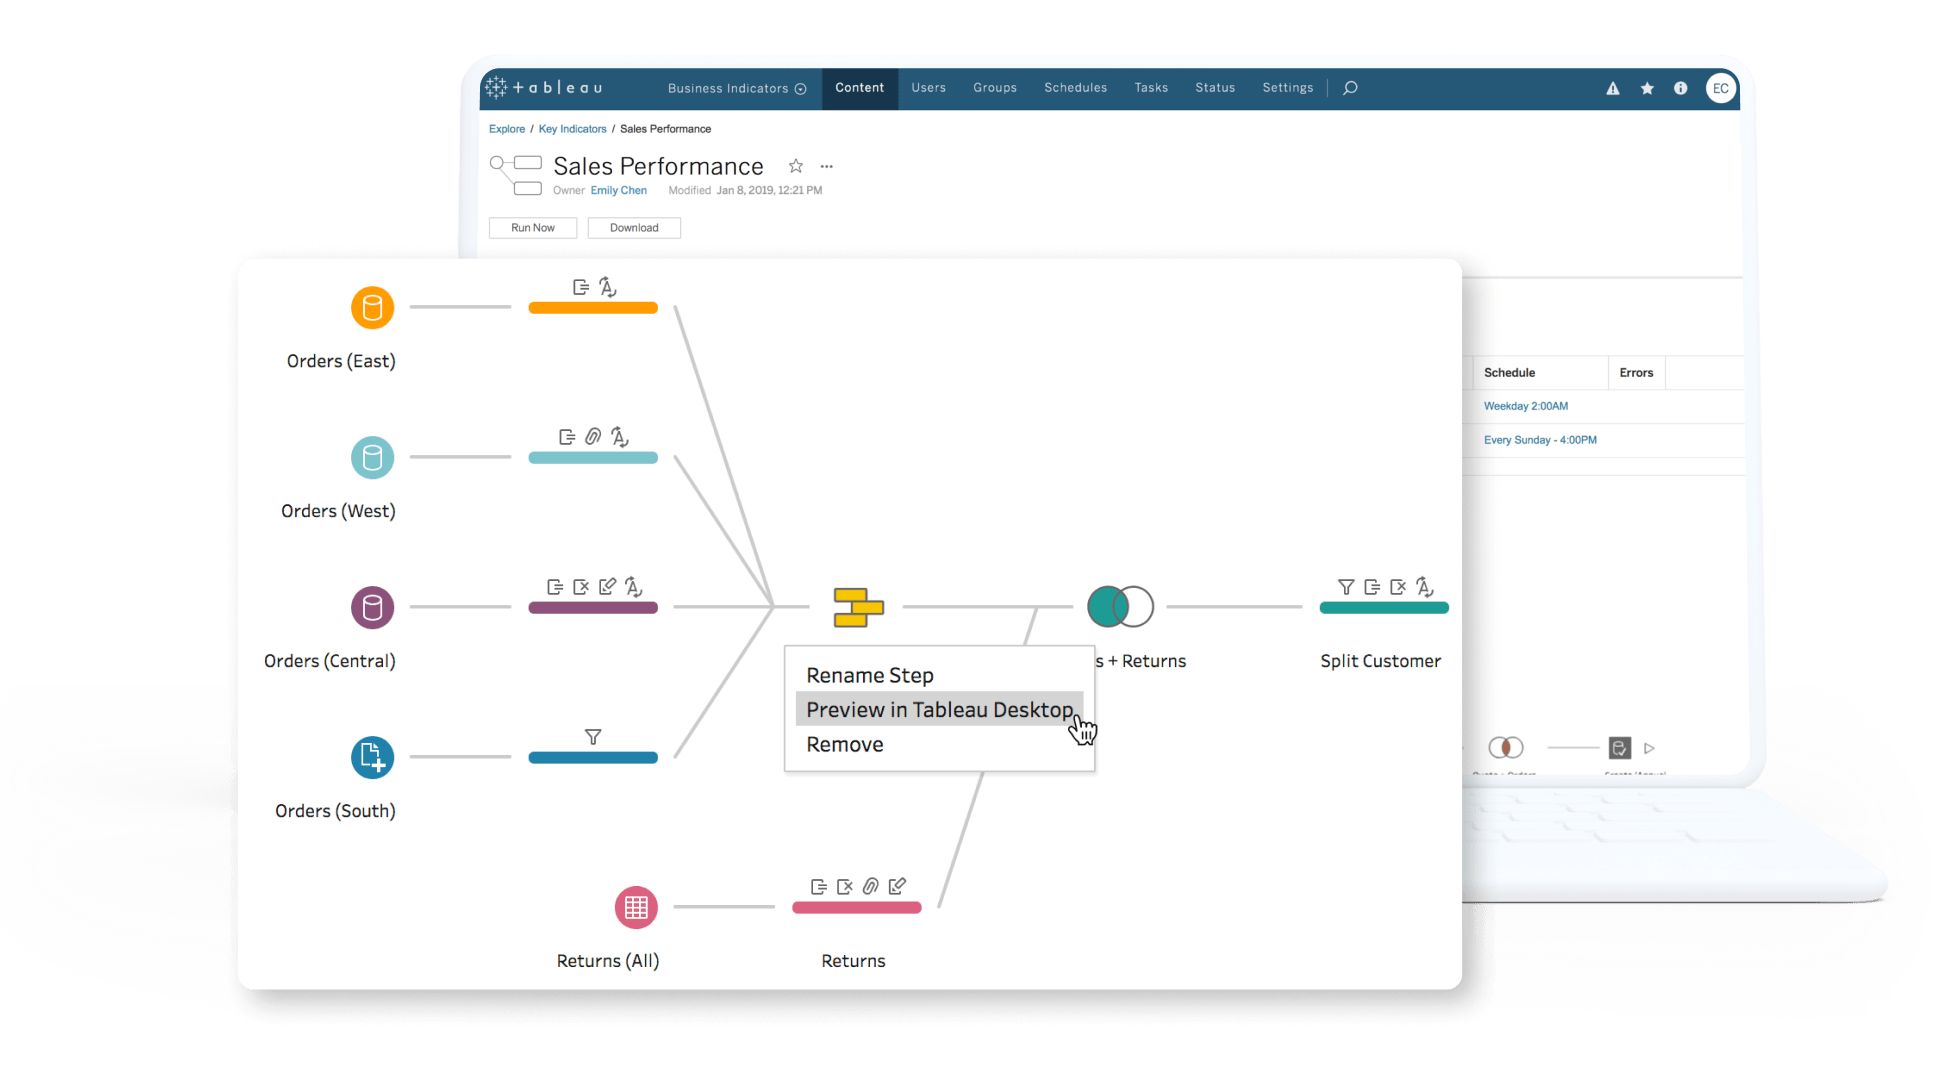
Join Step
Easily join data
The Join step in Tableau involves combining data from two or more tables based on a common field, creating a single unified dataset for analysis and visualization. This process allows you to merge related information from different sources, enabling more comprehensive insights and reporting. You can see the impact of joins as you create data sources or write them back to your database. You can also define relationships between tables so end users can start using the system without needing to understand the underlying level of data granularity.
Keep Only
Quickly filter visualizations with a single click
Keep Only is a filtering action that retains rows of data matching the selected values while excluding all other rows from the view. This helps focus analysis on specific data subsets, revealing insights and patterns related to the selected criteria. You can drill into specific areas of a visualization without navigating long or complex filter lists. It allows you to select relevant points and share customized insights with stakeholders in a highly visual way.
LOD Expressions
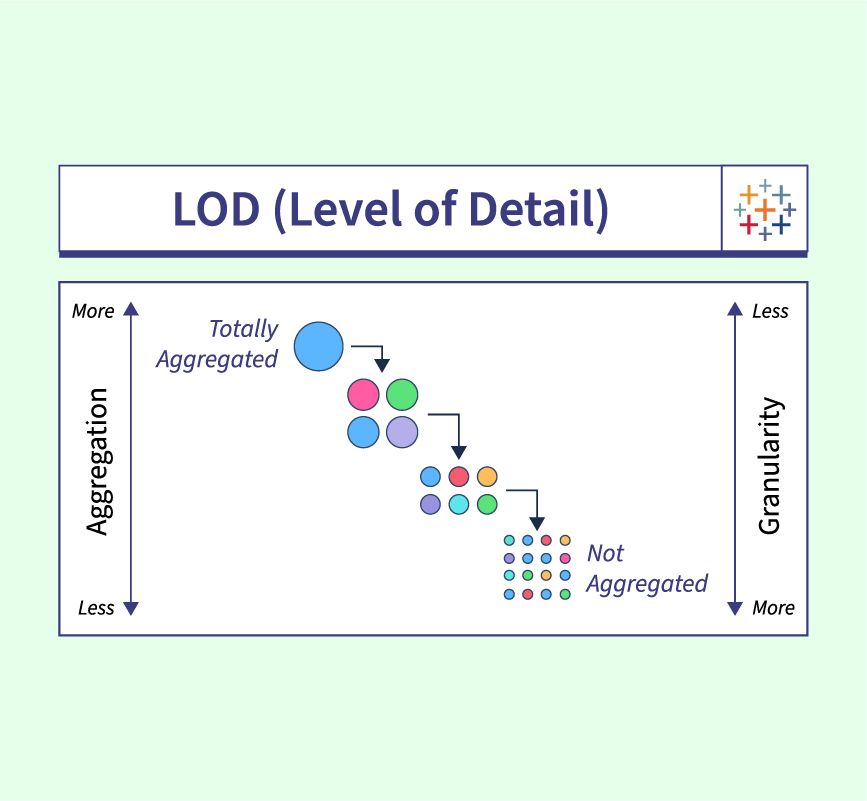
Create flexible, detailed calculations with ease
Level of Detail (LOD) expressions run complex queries involving multiple dimensions at the data source level instead of bringing all the data into the Tableau interface. LOD expressions provide an efficient way to calculate sets that are not at the level of detail of the visualization. A simple example is adding a dimension to an already aggregated value. They help you quickly get answers across multiple levels of detail within a single visualization. You can explicitly define the level of detail at which a calculation is performed, independent of the viz. You can also create more complex dashboards to display different levels of detail for different visual components, if needed.
Metadata API
Query and explore metadata about Tableau content and external assets
The Metadata API discovers, tracks, stores, and then surfaces information about Tableau content. Content can be categorized by type (for example, tables or workbooks). Content may be unique to Tableau (such as embedded data sources and calculated fields) as well as external assets that are not unique to Tableau (such as database tables and columns). You can explore the data and metadata used across your organization and perform impact analysis to understand how upstream and downstream changes affect workflows. The Metadata API also enables you to leverage strategic partners such as Alation and Collibra for deep integration with their purpose-built data catalog services. Included with the Data Management SKU.
Nested Projects
Segment content and users to meet your access requirements
Nested Projects allow analysts to have full control over how content is organized within their area. They can create subprojects, assign ownership to appropriate individuals, and then manage those projects and everything within them. You can grant granular access to content across departments, teams, or individuals and streamline administration by allowing project leaders to oversee related permissions and content. Nested projects also allow you to set permissions at the top project level and have them cascade to all subprojects.
ODBC Connector
Bring all your data into Tableau with ease
The ODBC (Open Database Connectivity) connector for Tableau acts as a bridge between Tableau and various databases, enabling connection and interaction through a standardized protocol. ODBC is an industry standard that allows different software applications to access data. The ODBC connector enables access to any data source that supports the SQL standard and implements the ODBC API. By installing the appropriate ODBC driver for a specific database, users can create data source connections in Tableau, making it easier to retrieve, query, and visualize data. This allows you to bring data into Tableau extracts and use the full power of Tableau to work with your data.
Prep Conductor
Easily automate your data workflows
Tableau Prep Conductor allows you to use Tableau’s scheduling and monitoring capabilities to automatically run your flows and refresh flow outputs. It also enables users to view and monitor detailed information about their flows. When a flow fails, it generates alerts. Tableau Prep Conductor also helps users review flow results and edit existing flows. Prep Conductor is fully integrated with the Tableau platform, allowing analysts and data stewards to leverage the power, permissions, and security of the server environment. Included with the Data Management SKU.
Quality Warnings
Automated alerts across all your data content
Quality Warnings are a feature of Tableau Catalog that provide automated alerts about data content so you can resolve issues before they occur. You can set data quality warnings on data sources, databases, tables, flows, virtual connections, virtual connection tables, and columns. You can also use this feature to track events such as extract refresh failures and flow run failures.
Table Extensions
Bring advanced analytics and predictions into your data
Raw data is valuable on its own, but transforming it unlocks new possibilities and insights. To truly harness the full potential of your data, you need the ability to modify it using familiar tools before analyzing it in Tableau. By using Table Extensions, you can unlock new data and transform, enrich, score, or modify your data using analytics extensions such as Python, R, and Einstein Discovery. By adding enriched data into Tableau’s data layer, you can uncover deeper insights at the speed of business.
Unified Tooltip
Get more context for your existing tools
Unified Tooltip is a highly useful feature that allows users to access up to six previously separate tooltips at once. It prioritizes information based on relevance so users can quickly access the most important details. With this feature, users can easily identify field names, table calculation details, and field comments in one convenient location. In addition, it provides context for error messages directly within the tooltip. Users can also quickly identify which worksheet filters are applied. This unified tooltip is available for marks on all shelves, making it a flexible and valuable tool for users.
VizQL
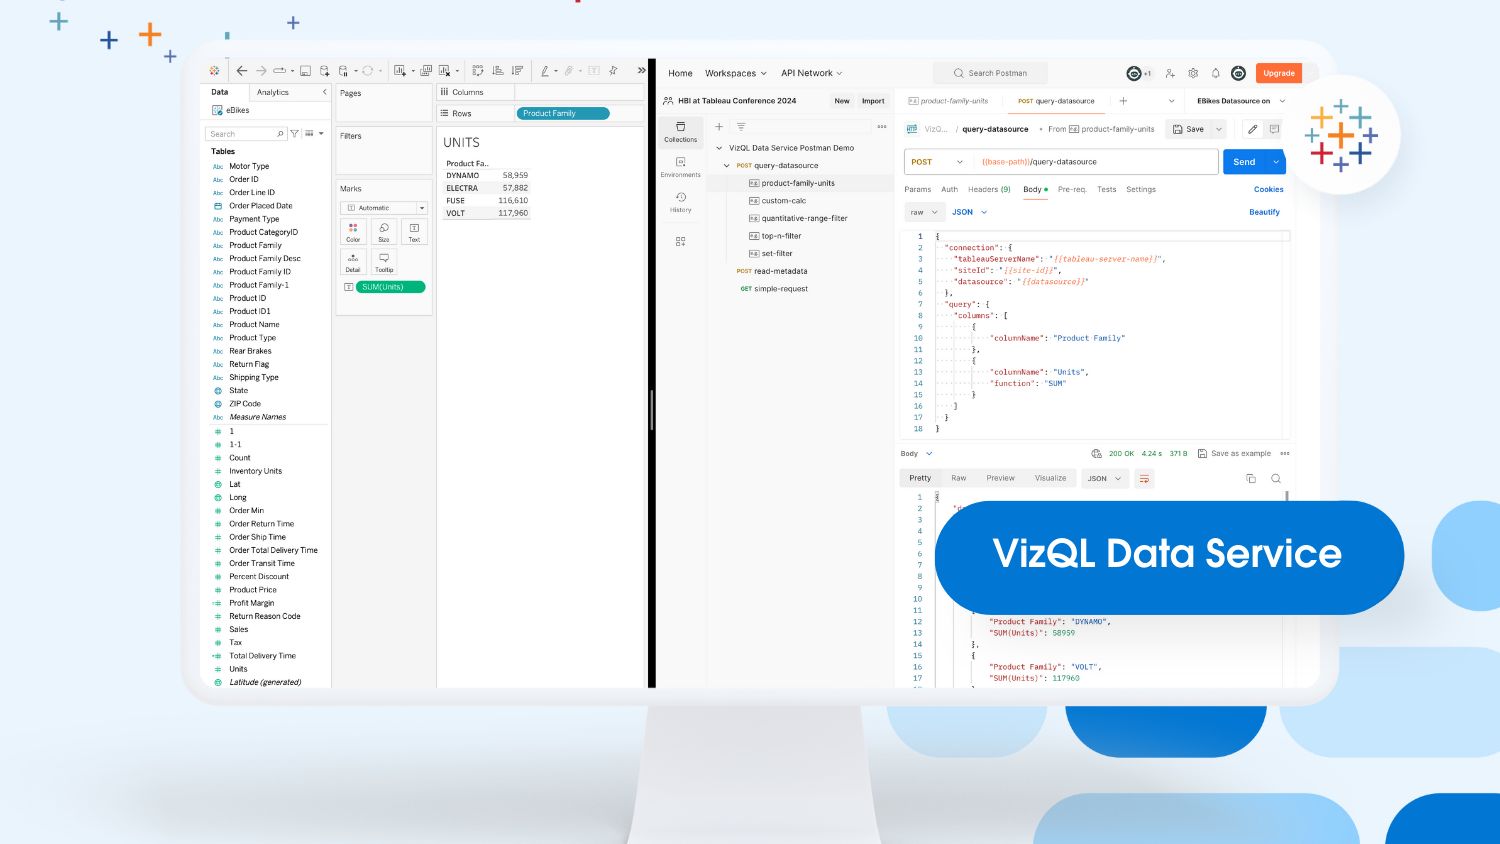
A visual query language for analytics
VizQL (Visual Query Language) is Tableau’s proprietary language used within its architecture to translate user actions in the visual interface into queries and operations for data retrieval, aggregation, and transformation. By bridging the gap between visual design and data access, VizQL enables users to easily create interactive visualizations. It handles complex operations and calculations behind the scenes to generate meaningful charts, graphs, and maps.
Workbook Optimizer
Easily implement performance best practices
Workbook Optimizer is a tool that evaluates whether a workbook follows specific performance best practices. It reviews key design characteristics and compares them against recommended guidelines. The results page displays a prioritized list of specific recommendations, guiding authors on how workbook design choices impact performance. This allows users to benefit from the collective expertise of Tableau product experts and the broader community without leaving the platform.
Exchange
Extend your Tableau platform
Tableau Exchange is a large online marketplace offering a wide range of accelerators, connectors, and dashboard extensions to enhance your Tableau environment. With just a click, you can easily discover, search, sort, and filter through countless offerings that meet your specific needs. This powerful platform enables you to leverage prebuilt solutions from diverse data teams, helping you maximize the value of your analytics investment.
Year Over Year Growth
Answer a common question in just a few clicks
Year-over-Year (YoY) growth in Tableau involves comparing a specific metric or measure between two consecutive years. In Tableau, you use clicks rather than complex calculations to answer a common question: How does this compare to last year? And you get the answer instantly.
Zoom and Pan Controls
Customize how people interact with data
Zoom and pan controls in Tableau are interactive features that allow you to adjust the level of magnification (zoom) and navigate around (pan) within a visualization. Zoom controls let you focus on specific details or get a broader view, while pan controls help you explore different areas of the visualization. These features make interactive data analysis more engaging, enabling you to dive deeper into specific data points, patterns, and insights within Tableau visualizations.
3. Benefits of Tableau for businesses
Data visualization
Tableau helps transform complex data into intuitive, easy-to-understand charts and graphs. This enables users to quickly identify trends and anticipate risks through analytical charts and dashboards.
Rapid creation of interactive visuals
With Tableau, creating interactive presentations is a simple process thanks to drag-and-drop functionality. The interface allows extensive customization while preventing users from creating charts that deviate from accepted best practices for data visualization. You can explore many impressive examples in the Tableau Gallery.
Ability to work with multiple data sources
Organizations around the world rely on large data sources to gain critical insights that support business operations. Tableau, with its intelligent features, can connect to multiple data sources, including spreadsheets with large datasets, non-relational data, cloud-stored files, and many other Tableau-supported sources. Tableau links all these different data sources together and blends them to create stunning visualizations.
Conclusion
Salesforce
Salesforce CRM is one of the world’s leading customer relationship management (CRM) platforms, widely used by both large and small organizations across the globe. With flexible features and applications, Salesforce helps businesses strengthen customer relationships, optimize sales processes, and drive revenue growth by providing powerful information and management tools.
Key features of Salesforce that support effective business management include marketing management, customer relationship management, sales management, and integration with other applications and systems.
About OMN1 Solution
OMN1 Solution is a leading Salesforce partner in Vietnam, specializing in delivering advanced technology solutions that help businesses optimize operations and enhance performance. With a team of highly experienced experts and deep market understanding, we not only provide breakthrough solutions but also accompany enterprises throughout their comprehensive digital transformation journey. OMN1 Solution is proud to be a trusted choice of major partners and remains committed to continuous innovation and development for the sustainable success of our customers.